- Look at boards and talk about similarities and differences
- How does that compare to ______?
- Show me where? (when students say an idea)
- That's interesting, how did you come up with that?
- So what I'm hearing…
- When groups present different versions of labs, ask other groups questions and see if they buy in
- Do you think…
- For yes/no questions, teach the class as a whole to do thumbs up/down immediately
- What else?
- Let's vote on this- to make it easy, I'll give you multiple choice…
- Talk that over in your group/check with your neighbor…
- I'm going to write all of your answers in a nonjudgmental way
- Ok, I see a lot of people nodding their heads, that makes me feel good
- Select the least capable student to explain for group who is still capable
- I noticed this was different (not necessarily wrong), can you tell me why?
- Hand up if you and your neighbors noticed the same thing… Is this a coincidence?
- Alright, I'm ready. Now listen, (pause) this is important. You guys ready?
- Say more about that…
- I love what you have done. You have done really good work and you've worked hard.
- Does this mean ______… (something it doesn't mean)
- Does your board need editing? ______, what do you think?
- I'm going to ask some important questions in a moment here…
- Purposely have students make a mistake (like a game) and see if others find it out
- Let's hold off attacks on other answers and just defend some
- Hold on, they was we do classroom discussion…
- Don't worry, take your time, we'll wait…
- To the whole class: "focus, focus, focus, gentleman, ladies…"
- Can we change your board to represent that?
- Discuss (and add if needed) critical competitors
- Give a good scenario to compare with
- I've noticed…
- I'm wondering…
- Hmm…
- For worksheets- do not tell others how to do worksheets. Correct and make additions in a new color so that you can see the change in your thinking
Tuesday, July 14, 2015
Introduction to White Boarding and Modeling
Here are some tips and phrases that can be used for white boarding in all units. White boarding is what we do- it is important! Most quotes are compliments of either Don or Laura- thanks for all of your modeling!
Unit 1 - Scientific Thinking
Unit notes here. Disclaimer: these notes are scanned from a composition notebook, which makes the formatting awkward when put into pdf format. Also, I make no claim for any of the work in the scanned notebook or worksheets to be absolutely correct, as they were all a work in progress and have not been altered from their original format.
-After getting students into groups (and change groups routinely so that students do not get entrenched in the same roles), start off the year with a get to know you white boarding session
-Incorporate the FCI pre-test into the start of the year and explain its background and importance. It might be beneficial to do it as a class, broken into smaller chunks.


-Unit 1 Worksheet 1 - Graphing practice
-8 Mini Lab Stations- have students complete as many as they can in a set amount of time


-Summary: What do you look at when analyzing data/graphs?
-After getting students into groups (and change groups routinely so that students do not get entrenched in the same roles), start off the year with a get to know you white boarding session
- Each person draws a picture representing themself on the board, and then they draw 1 picture as a group in the center of the board, representing something that is unique to their group.
- Set the tone for what group work and white boarding will be like
- The Inquiry Project- Discussion Videos
- Give students prompts to use for discussion
- Address each other by name
- Give students expectations/norms. discuss, revisits, remind at the start of discussions
- If you just let reliable kids talk, "the rich get richer and poor get poorer"
- Do another session with "I like when teachers…", "I don't like when teachers…", and then the teacher does a "I do/don't like when students…"
-Incorporate the FCI pre-test into the start of the year and explain its background and importance. It might be beneficial to do it as a class, broken into smaller chunks.
- You guys all have ideas of how the world works based on your experience and we're going to have lots of discussions about your ideas this year. We all come to the table with a lot of different background experiences- none of us are confused about that here. :)
- Example for discussion: The real meaning of mph video- some people will get this, some won't. You all will fall in different categories of having more or less understanding at different times throughout the year. This girl does a really good job of applying her understanding the idea in question at first, but then she gets more confused, and she does not have the same understanding that her husband does. Let's be understanding of each other and let each other discover meaning as it comes to them- you cannot force someone to understand something by telling it to them.
- I will be giving you new experiences to challenge and add to what you know. You will be developing ideas through your experiences and then apply those concepts to new situations.
- Have a growth mindset- show students this video! Teachers need to praise students for the effort and hard work, not intelligence! "Hard work beats talent when talent doesn't work hard!"
- Could incorporate the bouncy ball bouncing back under the table, verses forward, verses straight down

- Is there a relationship between inches and centimeters? This is your research question.
- This is a crucial moment- follow group expectations and nobody likes a no-it-all. People don't want you telling them everything- let people have their own aha moment- ask them questions to help them.
- Can you start with a t-chart for data and then make a group to represent your data? Make sure you have at least 5 data points!
- Students collect data and put it on a white board. Every section on the whiteboard needs to be in different colors. The axes, dots, and line all need to be different colors. Perhaps have students record their own information for note example purposes after the discussion. Have students check each other's work and measurements as they work together. Do NOT conquer and divide!
- For the teacher to do while students are working:
- Walk around and monitor student progress. "I appreciate the work you are doing in the discovery process."
- Probe for deeper understanding- question them for them to go farther in their thinking
- Scaffold the steps for them step by step- do give all of the directions at the beginning- they'll forget them anyways. Maybe write the directions on the board though in case I don't get to a group in a timely fashion?
- Try to know what they know and get them to know what they know- make them think about why they did something
- Watch for: cm/in vs. in/cm (talk about inverses later), labels and numbers (pick a good range) on graphs, multiple ways of doing this (measure actual objects, piece of paper around the stick)


- Have students then circle up for discussion. (Remember in discussion- "no hogs, no logs")
- Why did you put in and cm where you put them on the graph?
- Why did you draw the line to (0,0)? Did you measure it? A good question to always ask yourself when making graphs in this class.
- So let's talk about this… what do you see? (increase/decrease?, linear?)
- Can you see in patterns in the data? (easier if using whole integers)
- Can you find the slope of the line? Must include number and units!
- Can you write an equation for the line?
- Can you write a sentence to describe the slope? It must start with "for each" or "for every".
- Follow-up with discussing different types of graphs:
- direct vs. inverse
- linear (y=mx+b) vs. parabola (y=Ax^2) vs. square root (y=Ax^0.5) vs. hyperbola (y=A/x) - what do the equations for each look like? Don't worry- your technology can figure out these equations for you! I will try to keep the graphs simpler (linear) for younger students.
-Unit 1 Worksheet 1 - Graphing practice
-8 Mini Lab Stations- have students complete as many as they can in a set amount of time
- What has to be included in every writeup/white board?
- Title/names
- Research question
- Predictive graph- it's SO important to commit to an opinion ahead of time. "These are very good, not necessarily because they are right, but because they are testable."
- Data data- include units
- Diagram/1sentence explanation of what was done (process/procedure/setup)
- Graph with labels- include units
- Slope and "for every statement", if linear
- Equation of the line- may use technology to find the line of best fit after plugging in data points and making a scatter plot
- Conclusion to the original question- direct/inverse, linear/parabola/hyperbola/square root
- Show students the materials provided. For each set of materials (as you're going over them) ask:
- What do you notice is different about these?
- Could we do a lab on that?
- How are you going to measure ____ and ____? Choose data points that have a factor of 10 if possible.
- Have students come up with the research question for each:
- Dowels of different lengths- What is the relationship between mass and length
- Cardboard cutout shapes (some irregular)- What is the relationship between perimeter and area? (explain using graph paper for area- print squared graph paper where squares are 1cm x 1cm)
- Mystery items in a cup with the number of items in the cup written on it- What is the relationship between the number of objects and the mass?
- What does the y-intercept mean?
- What does the slope mean?
- What is the mass of each object?
- What would the mass be if there were 10 objects?
- Pendulum- what affects the amount of time to swing back and forth once (period)? (discuss benefits of timing more than 1 swing to get the period and constants for each experiment)
- What is the relationship between the length of the string and the period?
- What is the relationship between the release angle and the period?
- What is the relationship between the mass and the period?
- Different size spheres- What is the relationship between volume and mass? (explain water displacement)
- Circular objects- What is the relationship between diameter and circumference? (string to find the circumference)
- More circular objects- What is the relationship between diameter and area? (graph paper for area; come up with area formula after using equation and looking at data table)
- Balancing fulcrum- What is the relationship between mass and distance from the center? (try picking biggest rand smallest numbers possible and at least 3 numbers in the middle)
- Perhaps pick some other relationships related to students to also include- hand width vs. wing span, etc.
- Each lab must have at least 5 data points each - again, NO dividing and conquering
- Students must come up with all numbers on their own from measurements- no using formulas, googling, etc. You may only check your numbers after you are done.
- After the designated time period, assign each group 1-2 labs to white board. Have it so that each lab the class is white boarding has as least 2 groups white boarding it in order to provide that important critical competitor.


-Summary: What do you look at when analyzing data/graphs?
- Slope and units
- Equation and y-intercept
- Direct/inverse and Linear, parabola, square root, hyperbola
- Values/trends in data
- Area under the line
Unit 2 - Constant Velocity
Unit notes here.
-Idea: Give lab practicum challenges at the beginning of units, but do them at the end. This unit is a t-bone crash between two different buggies.
-Buggy paradigm lab (to start learning something in the unit)


-Unit 2 Worksheet 1 - Constant velocity on position vs. time graphs. Students must do the worksheets on their own- don't help others- that hurts them in this case.
-Add in a pictoral model - motion maps.
-Constant velocity deployment unit work:
-Lab Practicum: 2 Buggies T-bone Crash

-Idea: Give lab practicum challenges at the beginning of units, but do them at the end. This unit is a t-bone crash between two different buggies.
-Buggy paradigm lab (to start learning something in the unit)
- Run the buggy and list student observations about it.
- Is there anything on this list that is uncertain? Can we verify that the speed is constant?
- How do we measure speed? (can't do it directly) What can we measure? (d and t)
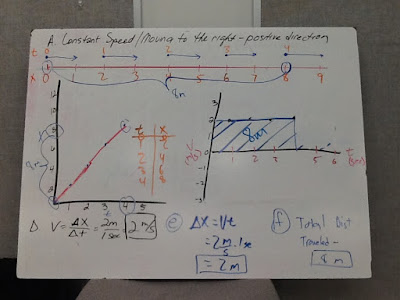
- Have each group do the same part one, and then a different part 2 (make sure original starting line important as "zero"):
- start at negative position and move toward zero
- start at end point and head back to zero (with same car or with different car)
- start at zero and head the opposite (negative) direction
- Start at a certain distance and still go forward
- Start at the same place but with a different speed car
- Opposite direction with a different speed car
- Each group has 2 data tables, and drawings to show what they did, but both lines on the same position vs. time graph and later add a velocity vs. time graph.
- Did we all do the same part 1? Tell me about it…
- What does this graph tell you?
- What's the same/different from part 2?
- What does the same distance from zero positive or negative mean?
- Tell us about the distance each went in the same amount of time, say 5 seconds
- What does the y-intercept mean?
- How does the slope/steepness of the lines compare?
- Is a constant speed also supported by the data table?
- Can we agree that we will call to the right positive and towards the left negative?
- Summary: Slope of the line = velocity of the car and a straight line means it was a constant speed


-Unit 2 Worksheet 1 - Constant velocity on position vs. time graphs. Students must do the worksheets on their own- don't help others- that hurts them in this case.
-Unit 2 Worksheet 2 - Constant velocity with velocity vs. time graphs. Conclusions from worksheets 1-2:
- The slope = velocity = d/t (rise/run)
- Equation of the line is y=mx+b, where the y-axis is position, the slope (m) is the velocity, the x-axis it time, and y-intercept (b) is the position at time zero. Therefore, d=Vt+do (do being the position at time zero).
- So the change is distance = v*t
- Problem #7- the displacement is the change in the position (final position - position at time zero)
- Problem #5-7- Shade in 1 sec between your line and the horizontal axis on #5. Could we find the area of that? Did it move 1 m in 1 sec? Try it with the other times.
- On a velocity graph, area = b*h = s*m/s = m, which matches displacement = v*t. The area between the line and the horizontal axis = the displacement.
-Add in a pictoral model - motion maps.
- Flash lights on and off to beat/metronome or open/close eyes and run buggy
- Lights off, "Ah, I don't know where the car is…"
- Lights on, "Ah, where'd it go? Oh, it's way over there…"
- Draw a ruler on the board. What would be easier to draw every second to show where the car was? (a dot) Always draw the dots first.
- What can you tell me about the dots? What does the spacing indicate?
- Now run the car the opposite direction. How can I show this differently? (draw arrows random sizes) What's wrong?
- Why should the arrows be the same size?
- What do the arrows represent? both speed (magnitude) and direction -> velocity
- What do the dots represent? The dots must show the position and time- where the car is every second. This means 5 dots on a motion maps means 4 seconds, because the first dot is time zero.
- Run a faster/slower car. How would this look different? Draw it.
- Make a d vs. t data table, d vs. t graph, x vs. t graph, and v vs. time graph to match both motion maps.
-Constant velocity deployment unit work:
- Tips- select certain questions appropriate for each group and do not point things out to students. They need to come up with the ah-ha moment themselves.
- Unit 2 Worksheet 3
- Reading- motion maps
- Unit 2 Worksheet 4 - Constant velocity with all motion representations

- Unit 2 Worksheet 5 - Constant velocity stacks of motion representations
-Lab Practicum: 2 Buggies T-bone Crash
- Both buggies must start at least 2 meters away from the crash point. You may only have one buggy running at a time, and you must stay off the crash course until it's your turn to go. (Can limit students by making them release it at the same time or not allowing a stopwatch during the test so they have to calculate the distance.)
- Alternate idea: Do a head on crash from a certain distance and they have to put the x where they the buggies will crash.
- On their whiteboards, student must show work- d vs. t and v vs. time graphs with displacement on both graphs and a motion map
- Great time to introduce using motion detectors to test the speed of both cars- show how to get both graphs and slopes and equations

Unit 3 - Constant Acceleration
Unit notes here.
-Idea: Give lab practicum challenges at the beginning of units, but do them at the end. This unit is a t-bone crash between an accelerating car and a constant speed buggy.
-Push a car across a track at a constant speed.

-Incline Car Lab Extension Worksheet (#1-6)

-Do a ball rolling down a ramp into a track examples together:


-Unit 3 Worksheet 1 - Constant acceleration representations
-Stacks of Kinematic Curves Worksheet
-Then add mathematical piece for connection between the equations of all of the graphs. To make more complex graphs, make sure for these graphs that velocity is not zero at time zero (start moving before starting collecting). Also demonstrate the area under the curve is still the displacement.


-Lab Practicum: Try to get an accelerating wind-up car (or fan car) to crash with a buggy car. Students may not use a time or count during the actual test. Both cars need to start 2 meters away from the crash location.

-Inquiry Labs: What are some things that you could change to affect the acceleration of a car on a ramp? Have each group test a different relationship.


-Unit 3 Worksheet 2 - Constant acceleration representations
-Unit 3 Worksheet 4 - Constant acceleration velocity graphs and story problems
-Idea: Give lab practicum challenges at the beginning of units, but do them at the end. This unit is a t-bone crash between an accelerating car and a constant speed buggy.
-Push a car across a track at a constant speed.
- What do you notice?
- Does it look constant?
- What does it sound like?
- Graph with your finger in the air: d vs. t, v vs. t, what would the motion map look like?
- What will it look and sound like now?
- Will the graphs and their lines look the same?
- Will we be able to graph it by marking every 1-5 seconds like with the buggy? I have a metronome we can use to count the seconds, lets try.
- What is I lessen the angle. Will this be different?
- What can we test? What is the relationship between position and time of a car on an angled track?
- Have students put data in a data table, motion map, and position vs. time graph.
- White boarding: We all did the same lab but why do we have different data? What's different and the same? What do the coefficients tell us? What do you notice about the dots and arrows on the motion maps?
- Summary: The distance traveled in a second increases every second because it gets faster every second as it goes down the ramp. Can we do a lab based on the velocity?
- Using the data from part 1, we will approximate the velocity by what we came up with in the previous unit on constant velocity: v = change in distance/time
- Have students extend their data table to have a column for velocity that they will calculate. There will be one less data point for this column.
- Make a velocity vs. time graph now. What time should those velocities be graphed at? The times to match those velocities should be the halfway points for those time segments.
- What is our line like now? (straight) Wow look- the coefficient this time is about double the d vs. t coefficient.
- As time increases, what happens to the velocity? Increasing in even, directly proportional increments means that it has constant acceleration.
- What do the different slopes mean? What are the slope units? Can you put it in a for every statement? If you started at rest and let it go for 1 sec, how fast would it be going? For 10 seconds? Which car has the biggest/smallest coefficients?
- Summary: Slope = acceleration = change in velocity/time
- Make a new graph now, of acceleration vs. time; and add acceleration arrows to motion maps.
- Also can try the same thing with a motion detector and see how close your numbers are to the sensor's numbers.

- What's up with the velocity and acceleration arrows being in the opposite direction? Does negative acceleration always mean slowing down? (no- #3)
- How do acceleration arrows compare to ramp direction and steepness?
- How do acceleration arrow sizes compare the the change in the velocity arrow sizes?
- On #5-6, does time up = time down?
- Each group pushes a car up a ramp, but some are sloped to the right/left and motion detectors are either to the right or left.
- sloped up to the right, motion detector right
- sloped up to the right, motion detector left
- sloped up to the left, motion detector right
- sloped up to the left, motion detector left
- Each group makes a motion map, x vs. t, v vs. t, and a vs. time graphs. Whiteboard them, then circle up.
- Compare motion maps
- All get slower then faster
- Does it stop at the top? How do you know?
- Do dots on the way up and down the track line up?
- Compare position graphs
- What does a line up/down mean?
- What does slope steepness mean?
- Compare velocity graphs
- How does the position graph match this? Use straight-edge "slope-o-meter" to follow the slope along the position curve to show how velocity changes.
- How do I tell the direction of the car?
- How do I tell the change in speed of the car?
- Compare acceleration graphs
- Why are some positive and some negative? (Which way is downhill?)
- Is this a rule? Do the incline and acceleration match?
- Does negative acceleration mean slowing down? Always? Sometimes? Never?
- Conclusion: opposite velocity/acceleration signs mean slowing; same velocity/acceleration signs mean speeding up (label the parts as pos/neg on the graph and remember "the acceleration finger dance")
- For example, If the car is: the velocity is: the acceleration is:
- -slowing positive negative
- -speeding up negative negative
- -speeding up positive positive
- -slowing negative positive


- Release a ball to roll down the ramp and onto the track. Each student draws their own motion map, position, velocity, acceleration graphs. On whiteboards, groups stack the graphs vertically so the times line up.

- Extension 1: Two balls released at the same time from different points on the ramp. What happens? Whiteboard to show what will happen to the distance between them.

- Extension 2: Release two balls form the same height, but at different times. What happens now?
-Unit 3 Worksheet 1 - Constant acceleration representations
-Stacks of Kinematic Curves Worksheet
-Then add mathematical piece for connection between the equations of all of the graphs. To make more complex graphs, make sure for these graphs that velocity is not zero at time zero (start moving before starting collecting). Also demonstrate the area under the curve is still the displacement.


-Lab Practicum: Try to get an accelerating wind-up car (or fan car) to crash with a buggy car. Students may not use a time or count during the actual test. Both cars need to start 2 meters away from the crash location.

-Inquiry Labs: What are some things that you could change to affect the acceleration of a car on a ramp? Have each group test a different relationship.
- What is the relationship between the ramp angle and the acceleration?

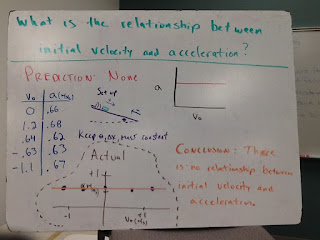
- What is the relationship between initial velocity (can change direction too) and acceleration? (no effect)

- What is the relationship between mass and acceleration? (no effect)


- What is the relationship between initial position (starting higher/lower on ramp) and acceleration? (no effect)

- White board, circle, and compare groups' data. Discuss why lines are similar but numbers are different.
- Does faster velocity mean more acceleration?
- At what angle would acceleration be greatest? (vertical)
- Have each group do multiple trials and get an average.
- Each group shares out their average.
- Does the mass or position affect the acceleration?
- Earth's free fall acceleration = 10 m/s/s! (10 is so much easier -and to ok to use- than 9.8)
- What does this mean? Make a motion map/picture. Why do the dots get further apart?
-Unit 3 Worksheet 2 - Constant acceleration representations
-Unit 3 Worksheet 4 - Constant acceleration velocity graphs and story problems
Unit 4 - Balanced Forces
Unit notes here.
This unit starts out differently- with brainstorming. Make sure to use teacher techniques for discussion- give students time to think, say more, and have what they are saying paraphrased. (See teacher talk moves.)

-What is force? List student ideas on the board.
-1st rule of forces: they must all be caused/applied by a physical object. Apply this rule to students' list of forces on the board. Should end up with pushes and pulls; might be uncertain about gravity and movement.
-Draw picture with arrows to show forces- a force diagram.
-2nd rule of forces: If the change in velocity = 0, the forces are balanced.
-Further examine forces:
-Introduce friction: Do a schema and force diagram for a heavy book pushed across the table (at a constant speed).
-Unit 4 Worksheet 1 - Force Diagrams. Do non-angled problems first, then angled problems.


-Lab followup: Establish the idea of weight on Earth (it's different other places) as being a measure of the gravitational field strength on Earth.

-Unit 4 Worksheet 2 - Angled force diagrams.
-Unit 4 Worksheet 3 - Various force diagrams. Do the same as above for Worksheet 2.


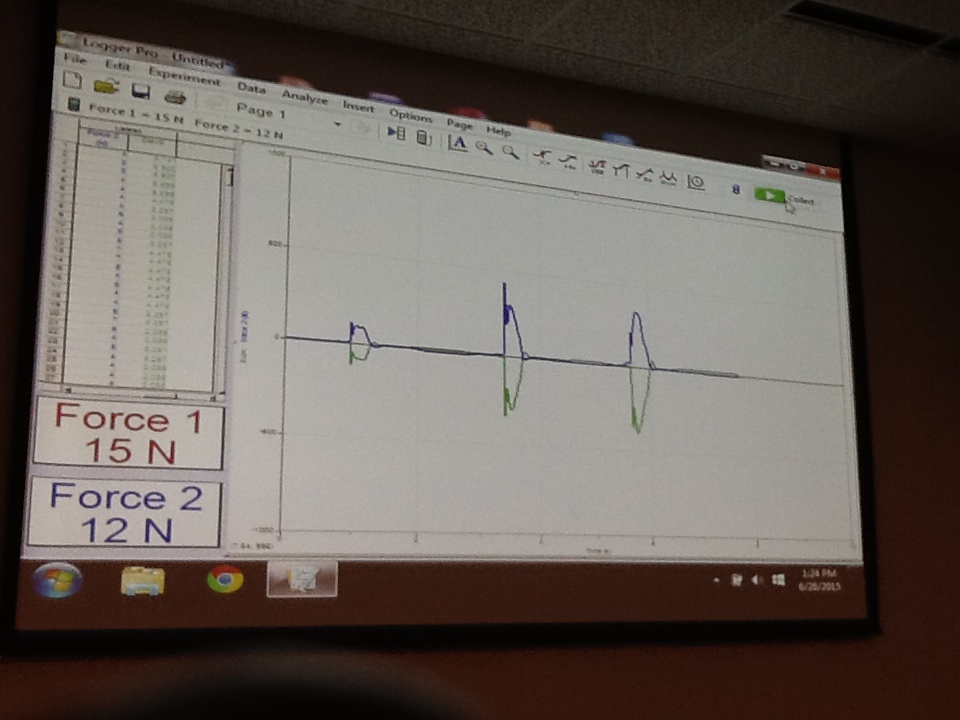
-Lab: 2 cars of a track with push force sensors on them. Have one car with more mass than the other. Try different scenarios and to see: which car will exert more force? Take data for trials from each scenario.

-Force pairs demos: Question for each- are the forces the same? Is the result (acceleration) the same? When is it or is not the same?


-2 cars with a string between them on a track and I pull on one of them. The second car has more mass.

-Unit 4 Worksheet 4 - 2 object system force diagrams


-Lab for higher students: Car on an inclined track to show students shadow components of gravity after they use spring scale to get the car's weight. Students hold the car on the ramp with a force sensor to get the force of the pull up the ramp also (see notes).


-Unit 4 Worksheet 3 #5-6 - Various Force Diagrams
This unit starts out differently- with brainstorming. Make sure to use teacher techniques for discussion- give students time to think, say more, and have what they are saying paraphrased. (See teacher talk moves.)

-What is force? List student ideas on the board.
-1st rule of forces: they must all be caused/applied by a physical object. Apply this rule to students' list of forces on the board. Should end up with pushes and pulls; might be uncertain about gravity and movement.
-Draw picture with arrows to show forces- a force diagram.
- First step- a schema. You may only show objects involved that are made of matter. (Can you hit someone with it or buy it at the store?) Use solid lines to connect touching objects, dotted lines for a force at a distance (only 4- Entire Earth/gravity, magnetism, electrostatics, and strong nuclear force). Air is not important unless it's not even (wind, moving, etc.).
- Give an example schema to students for holding a book up on your palm.
- For the force diagram, put a dot in the middle and draw an arrow from it to represent each force from the lines touching that object in the schema. How should the size of the arrows compare? Use the schema to make a force diagram for the book.
- Do some more practice: a bowling ball on the table, a tennis ball on the table (do with group). How do you decide the size of the arrows?
-2nd rule of forces: If the change in velocity = 0, the forces are balanced.
- Initially, this rule might just be that zero velocity means the forces are balanced.
- Use a hover disc gliding across a table at a constant speed as an example- think about the motion. The velocity is constant; acceleration is zero.
- Draw a schema and force diagram for the puck while it is moving at a constant speed. The past/future forces do not count (hand pushing or catching is not included).
- Is there any sideways force? Are the forces balanced? What does this mean about objects moving at a constant speed?
-Further examine forces:
- Do table push or just get in the way? Have a student hold things place in hands with eyes closed to demonstrate surface (normal) force. Also do with object on a spring, sponge, flexible whiteboard which will bend, and on magnets stacked on a pole.
- How do we measure forces? What units? Newtons on a spring scale. Have a student pull down with 5 N. What do I have to do holding it? I have to pull up with the same amount.
- Do a schema and force diagram for a box hanging on a string from a spring scale.
-Introduce friction: Do a schema and force diagram for a heavy book pushed across the table (at a constant speed).
- What do you notice about how it is moving? What does that mean about the forces?
- Demo: 2 whiteboard erasers with the fuzzy part rubbing on each other to show friction
- Draw a schema and force diagram. Must have 4 forces for them all to be balanced. How do you know how big to draw the arrows?
- Always ask yourself: Is there a surface pushing? Is there friction?
- But will objects move forward on their own? Ball in a car? Dry ice/hover puck on a table? Air hockey? Lunar lander simulation (not in html5 yet)? Only if there is friction slowing it down. No force is needed for motion, we just don't get this because we almost always experience friction.
-Unit 4 Worksheet 1 - Force Diagrams. Do non-angled problems first, then angled problems.
- In between the two types of problems, talk about shadow components. Use cutout arrows and a flashlight to show the shadow on a horizontal and vertical surface.
- As I change the angle, what happens to the shadow?
- How does the length of the real arrow compare the the shadow arrows? What is the longest a shadow can be- how?
- Shadow part = the horizontal and vertical components. On force diagrams when we start getting forces in more than one direction, vertical arrows balance together and horizontal arrow balance together.
- For the angled problems: does an even number of arrows = balanced and odd number = unbalanced?
- Is the angled string doing 2 things? What is it doing?
- Problem #3: A key takeaway- acceleration is in the direction of the unbalanced force.
- Does a string have the same tension through the whole thing? Do the demo in the picture below and have students vote before you turn the middle scale around.

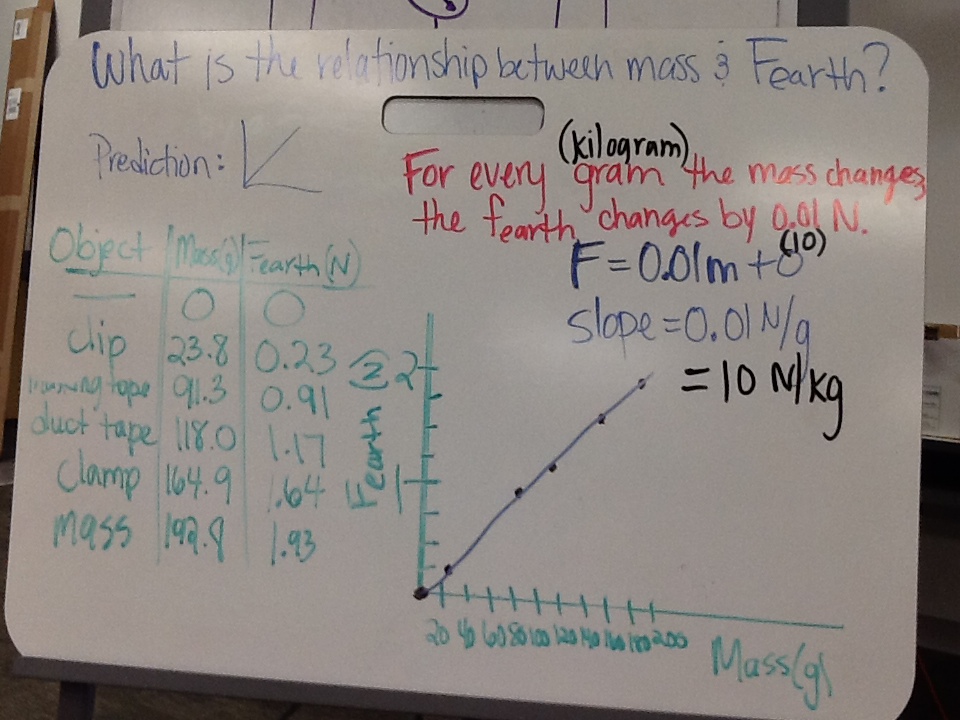
-Lab: with random objects, spring scales, balances.
- What could we measure here? What is the relationship between mass and the force of the Earth (weight)?
- Do you want to use g or kg? (Or let them do what they want and discuss differences later.)
-Lab followup: Establish the idea of weight on Earth (it's different other places) as being a measure of the gravitational field strength on Earth.
- Are mass and weight the same thing? Just different numbers?
- Force field- area of space where an object experiences a force like the force of the entire Earth pulling on us. On Earth, the gravitational field strength is 10 N/kg. This helps us translate between mass and the force of the Earth (weight). How do you get something's weight from its mass?
- What is mass? Show students inertial mass by having students push or receive a cart with/without mass on it to feel the difference.
- The change in how you have to move it is side to side, so that's not the weight- weight is up/down.
- There is a natural tendency of objects to resist change in motion (inertia/inertial mass).
- Newton's 1st law- objects in motion will stay in motion in a straight line if the forces are balanced (and the same for at rest).

-Unit 4 Worksheet 2 - Angled force diagrams.
- Students must use the following steps that will allow them to solve problems they have not seen before:
- 1. Schema
- 2. Force diagram
- 3. Shadow components- horizontal and vertical
- 4. Check vertical and horizontal forces separately for if they are balanced or unbalanced
- 5. Solve
- May also now explain force "nicknames"- Ff for frictional force, Fn for normal force (or use perpendicular force), Fw for weight (the pull of the entire Earth), tension = string
- Students may not draw force diagrams on the picture -> they aren't the same (the arrows represent force, not string)
- Tip: If there aren't enough misconceptions on the white boards, have some groups purposefully add some wrong things you suggest to create more for discussion in class circle.
-Unit 4 Worksheet 3 - Various force diagrams. Do the same as above for Worksheet 2.
- Demo: an object suspended from the wall and from a spring scale (may use a pulley). Show that as you pull it more horizontal, the force on the spring scale gets bigger (and if using a pulley, the string gets shorter).


-Lab: 2 cars of a track with push force sensors on them. Have one car with more mass than the other. Try different scenarios and to see: which car will exert more force? Take data for trials from each scenario.
- Moving same speed at each other
- Moving toward each other; one fast, one slow
- Moving in the same direction; on is faster and overtakes the other
- One is stopped and the other one hits it
- Keeping adding new tasks for each group as they go (add more mass to one car and redo scenarios, can you come up with a scenario where one has more force?, add a spring, etc.)

-Force pairs demos: Question for each- are the forces the same? Is the result (acceleration) the same? When is it or is not the same?
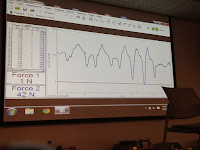
- Force plates- show how they work by having someone jump on it and do pushups on it and analyze the graphs produced


- Force plates- 2 people push and we sees who can push harder

- Youtube video- visualizing Newton's 3rd law with colliding carts. Do the metals bend the same? Is the force the same?
- Instruct me how to walk. Too hard? Instruct me how to jump.
- Did I accelerate?
- How did I accelerate? I can't push on myself. Did the floor push on me?
- Did I push more or did the floor push harder? Remember what we just did!
- Why did I move more?
- What way was each for between the floor and me?
- Now tell me how to walk again.
- Which way did I push?
- How did I move forward?
- What are other forces interactions that cause locomotion? (cars, space ships, canoe, swimming, helicopter- use toy for demo to show what happens if spun different directions!)
- If I want to move forward which way do I push?
- Newton's 3rd Law: All forces come in pairs that are equal in strength, opposite in direction, and act on the other object.
- Fa on b = Fb on a
- They are pairs if you can flip flop the label
-2 cars with a string between them on a track and I pull on one of them. The second car has more mass.
- Draw a schema and 2 force diagrams- one for each car.
- Show the force pairs between the two diagrams.
- Should unbalanced force be in the direction of the acceleration?

- No friction (acceleration) #3, 6, 9
- Friction (constant velocity) #1, 4, 7
- Idea you might come up with for a future lab: does the mass of an object affect its friction?


-Set a known mass/weight object on the table.
- How much does this weigh?
- Draw a schema and force diagram. How many forces are on the diagram?
- What direction are the forces in? Which is longer?
- Are these force pairs? Have the class split into sides by yes or no and argue. Students switch sides as they are convinced.
- Summary: Force pairs cannot be on the same force diagrams, because they are on separate objects and force diagrams only who the force(s) on 1 object.
-Lab for higher students: Car on an inclined track to show students shadow components of gravity after they use spring scale to get the car's weight. Students hold the car on the ramp with a force sensor to get the force of the pull up the ramp also (see notes).
- Draw a force diagram to scale with the shadow components of gravity. Is there a way to check if the numbers you get in the triangle fit together?
- You can have students compare the angle of the ramp to the angle of the shadow components. (Have each group do a different angles- 23, 28, 37, 53)
- For the normal force, put a marker vertically on the ramp and show how its direction changes as you incline the ramp. What do you notice? It's always perpendicular.
- Cool demo: Incline the ramp from horizontal to vertical with the force sensor holding the car in it's location on the ramp to see how the force on the graph produced changes (goes from 0 N at horizontal to 6 N at vertical for a 6 N object).

- Can you put strings in place of the surface (normal) force with the string pulling it up the ramp and have the car stay in place if you remove the ramp?


Fun teacher note- easy to use right triangles:
- 3, 4, 5
- 5, 12, 13
- 7, 24, 25
- 9, 40, 41
- 11, 60, 61
How it actually worked out in class, Fall 2015:
-Day 1: Measure free fall acceleration on Earth (from last unit)
-Day 2: Discuss free fall acceleration (data table and motion map); Mass in kg vs. N on spring scale lab (both are 10!) data collection and graph
-Day 3: For every statement for kg vs. N lab and discuss; Forces list/discussion, intro schema/force diagram and 1st rule of forces- caused by physical object
-Day 4: Further develop force diagrams:
*review schema/force diagram of object held in palm of hand
*show pulling on an object with a spring scale each direction is equal force; 2nd rule of forces- if v=0, forces are balanced (same size/opposite direction) (will modify this rule later)
*schema and diagram for two different masses objects in my hand; whiteboard and compare between groups and two objects
*does the table apply force to an object on it? objects placed in hands and on a whiteboard between tables
*example of a heavy object on the big scale- do schema and force diagram for object with numbers
*schema and diagram for scale which is held by one person and pulled by another (take reading of N on scale also); whiteboard and discuss number/size of arrows
-Day 5:
*schema and force diagram of hover puck moving across table; whiteboard and discuss
*modify 2nd rule of forces- moving objects can also have balanced forces; 0 acceleration = balanced forces
Subscribe to:
Comments (Atom)